I think I’m getting to be a cranky old man. If you didn’t know me, you would think I had nothing better to do than sit in my rocking chair criticizing the Ministry of Natural Resources and Forestry and, by association, the government for failure to manage wildlife effectively, and even for their incompetence.
I have more than enough to keep me busy without this, but here I go again! Half criticism, half rant. My opinion, with examples.
In order to get information for the last article (“Soapbox: It seems MNR uses imaginary moose to set harvest target”, published June 29 and which you can read here), I was referred to a file in the Ontario Data Catalogue.
This catalogue was established in 2019 under a directive (1). That directive was changed in 2021 (2) to Ontario’s Digital and Data Directive. The intent is to make publicly available all “data” that isn’t protected for legal, privacy, security or commercially-sensitive reasons.
As can be expected, these were created under a plethora of policies and limited by a number of laws.
Spreadsheets of confusion
“Data” is what you collect – individual hunter reports, moose aerial inventory plots. “Information” is what you turn it into – harvest assessment (reports) and population estimates. The first problem is that we are not being provided with data at all. We are being provided with information.
I received the “Moose Harvest Planning” information under a Freedom of Information Act request. Some problems with it were described in the previous article, but there are more.
It is a spreadsheet-style database that contains several individual spreadsheets (harvest planning, tags allocated, tags issued, and ”actual” harvest) that can be linked for calculations, etc. The underlying formulae are not included so it is difficult to understand how information is derived or to identify the source of possible errors.
When working with a spreadsheet, it is useful to pick column headings that are short (preferably the width of the values in the column) so that more than two columns appear on a screen. Typically, acronyms or short forms like, “B” for Bull, “C” for Cow and “Ca” for Calf, are used. A database will contain “Metadata” that describes what is in the columns.
This dataset does have a metadata description that is incomplete and uses numbers instead of the alphabetic columns that are used in the spreadsheet.
The Harvest Plan has column headings like: PLANNED_QUOTA_TOTAL_CALVES_NUM, PLANNED_QUOTA_ARCHERY_CHANGE_NUM and TAG_FILL_RATE_PROJECTED_OUTFITTER_COWS_NUM for values that are generally less than 1,000.
If you reduce the column width to get more than two columns on a screen, you get headings like “OTA_TOTA’ or “A_ARCH’. Completely impossible to work with.
OK, so let’s think about these titles.
We do know it is a “Plan” for “harvest” that creates “quotas”, and the value will be a “number” (or a per cent). We also know that there are four parts to a harvest plan: animals to be killed (the planned harvest, P); tags allocated (A); tags issued (I), and; the harvest (H).
The total harvest (T) may be divided among bow and gun hunters, resident hunters (R) and Tourist Outfitters (Out). We might suspect that a “change” is a “difference” (Dif) and that a “Tag Fill Rate” (TFR) is, in fact, a “projection” so the word need not be repeated.
The examples above could be changed to “P_Ca_T”, “P_Bow_Diff”, and “Out_TFR_C”. Much more workable and allows about eight or ten columns on a screen.
The entire harvest process, plan to hunt to harvest assessment, takes place during one calendar year. Even when it didn’t, as when the season ran into January, it is a “nominal calendar year” for planning and assessment purposes. Still, headings like PLAN_YR, TagYr, ACTUAL_HARVEST_YR (like there is a fake harvest year) are used when “Year” would do everywhere.
These little annoyances demonstrate sloppy thinking on behalf of the database developer. Certainly someone with little competence built — but did not use — the information. It further suggests the database is not used as a working platform, but rather a place to dump information, possibly in a manner that discourages use by others, if or when placed in the information catalogue.
Any professional who worked constantly with this database would have changed the headings, as I did.
Cutting firewood with a scalpel
I also requested the number of unclaimed tags in 2021. I would have been happy with an answer for the province, by age/sex class or even by WMU, Instead, I was referred to a catalogue file, the “Tag Allocation Process Results”.
It is very close to a true data file, containing 17,055 records, one for every four or five applicants and over one for every tag allocated. It took about 12 hours to embed formulae to get what I wanted. Partly my fault because I hadn’t used spreadsheets for many years and the spreadsheet program had changed.
There was no metadata description and an error in my thinking cost hours. As far as information goes, it is only useful to individual hunters to figure out where their application fared in the allocation process – if they can find it, that is.
Although there are a number of information sets that should be posted in the catalogue, I was able to only find two, the one above and one for “Hunting Activity and Harvest”.
There are other data sets, many I created, include wolf harvest from the 1950s, snow depth (for emergency feeding and research on the impact of winter), season dates (as historical information and for research on the effect of season timing and length), area of forest fires and logging (as measures of habitat change), and aerial inventory estimates (both annual and for population trend). Where are these?
Aerial inventories are highly variable at the unit level and although used extensively are poor estimates of trend. When I was working, there were no good statistical methods to derive WMU or provincial population trends. Perhaps there are now, but the current Provincial Wildlife Monitoring Program leader said he was uncertain how to do it.
I developed a simple technique, basically by estimating numbers for each year between surveys and adding them up within the five zones I used to aggregate information. More common sense than scientific, but the ups and downs evened out and resulted in smooth trends that matched our knowledge of what individual population surveys (albeit with increasing search effort) told us.
In my opinion, this is extremely important information for population management and for the public to know. As far as I know, this data set has not been maintained.
As a critic, the Hunter Activity and Harvest Information set is my absolute favourite. First, it isn’t about “hunter activity” at all, it is about “active hunters”. In the description, it says the file contains information from 2006 to 2017, but when you get to the “view or download” stage, it is described as “2012-2017”.
When downloaded, the file is called “Moose 2021” (as if it contained all the information on moose). The file contains “active hunters”, the estimated harvest of bulls, cows, calves and a total from 2006 to 2021 – yet another error.
Harvest information has been collected by MNR District since the 1950s and by WMU since the late 1970s, with both estimates collected during a period of overlap. I collected and compiled all that information. The current Harvest Planning file contains values from 1983 (albeit with missing information).
Why was that not used to populate this file, or why is the entire database (with hunter numbers) not posted in the catalogue? There seems to be no rhyme nor reason to the information or time period that is posted.
I’m not sure what “active hunters” are. Are these the folks who didn’t stay in playing cards during the hunt? There are “tag holders” and “estimated hunters” (from sampled harvest surveys) and “hunters” or ”reporting hunters” from mandatory reports, but “active hunters”?
Where is the information on days hunted, moose and wolves seen, wolves killed and whatever information is gleaned from asking activities in three WMUs? Is this just useless information collected for no reason?
Except for the three-unit stuff, the value of which nobody has yet explained to me, most of this is extremely valuable information if used properly.
It can be argued that asking hunting activities in three units is more accurate. When you consider that some hunters claim to kill moose they do not have tags for or in wrong units, the statistical errors in mailed-in harvest assessment, the huge errors in aerial inventories and the planning process itself, this supposed improvement in quality is meaningless.
It’s like using a scalpel to cut firewood. Far more accuracy than the job requires.
Asking information for three units also affects trend information. What is a “hunting day”? Is it a calendar day, eight hours, 12 hours or something else? When information was asked on one unit, it didn’t matter. It was just an index of effort for trend purpose and to “standardize” things like moose seen per day.
However, when you ask in multiple units, it does become material, at least in theory. If you hunted six hours in one unit and two hours in an adjacent unit, as I did in Kenora, how do you answer – one (calendar) day in each unit or three quarters and one quarter. As noted below it isn’t a big deal in the practical sense. It just adds confusion and unnecessary change.
When I did an assessment about 1999, only three per cent of hunters reported hunting in a unit different than where the tag was issued. “Errors” in reported days hunting, moose and wolves seen and wolves killed would be insignificant in the big picture and such “errors” tend to compensate because hunters move both directions across WMU boundaries.
Information in three units is lot of effort for no meaningful gain in information quality. Certainly not enough to affect the planned harvest in any WMU. Just more garbage information. Just more sloppy thinking. Perhaps computer-based harvest surveys might correct some of these errors, but the greater accuracy is still meaningless.
Mandatory reporting is not the panacea that many believe it to be (3). Kills may not be reported leading to underestimates of the harvest and population decline. There is no easy way to correct them as there was with voluntary reporting. It would require the same complex techniques used to determine rates of abortion or drug use when they were illegal.
Days hunted and moose seen are very important to validate population surveys. If hunters are seeing more moose per day, the population is likely going up. I’m skeptical regarding the value of wolves seen because of gamesmanship. Providing false numbers may be a tactic used by hunters to blame wolves for population decline.
In my day, information on moose seen, etc. was not appropriately organized for use in the planning process. Everything centred around aerial inventories. I was building the database, mostly alone and without formal training. I didn’t have time to do everything I wanted. Only in my last few months did they hire a database manager.
We started worked together to build a real database. The intent was to input data once and extract information in all its possible forms at the end. We didn’t complete it and I don’t know what happened to our work. It certainly doesn’t show in what I have been given access to. Hunting effort and moose observed (and hunter numbers) should certainly be included in a holistic “harvest planning” database that will chronical the entire history and become a useful planning tool.
Where have all the hunters gone?
When it comes to the information in the Hunter Activity and Harvest file, there appears to be a significant error.
The number of hunters has declined relatively steadily from 88,287 in 2006 to 38,743 in 2021. I doubt that is true. There is nothing in any the information I have seen to indicate numbers of hunters, only these incorrect values. The harvest values for 2020 do not agree with those presented in the Harvest Plan.
If you can’t trust one estimate, you can’t trust any. Again, this information set is useless.
Apparently, before information is made available in the catalogue, it goes through a review process. Neither the person who submitted this information, nor the person who reviewed it, had any idea what they were doing apparenlty. More incompetence.
When you criticize, it is incumbent that you offer something equal or better. As Wildlife Inventory Program Leader for Boreal Science, I published the results of all the inventories I was associated with (4, 5, 6, 7, 8). I don’t have copies of, or references for, the Aerial Inventory Reports. These reports were my form of an Information Catalogue, 20 years before the government saw fit to do it – and hopefully in a more useful manner.
In order to save a few pennies, all the science and tech reports were “temporarily” taken offline, but never replaced. So much for the governments commitment to science, which depends on research and peer-reviewed literature.
As far as the ministry is concerned, I never existed. I expect some folks wish that were true.
Interestingly, my daughter googled my name and found references for a number of my reports cited above. I have no idea how they got there as most were internal reports. Only the references were presented, not copies of the reports.
One of my final acts as a public servant was to complete the harvest assessment report for moose for 1999 and 2000 (7). I will use that as an example of what I believe a proper information system should look like, and there are things that could be improved.
In the publication, there are two tables per year. The first contains the basic information, the reported hunt information. The second table contains other interpretive information. At that time there was no data on wolves, or it would have been included.
In my opinion, the first step in building a meaningful information system, is deciding the best way to aggregate information. I chose the MNR regions used between about 1975 and 1996. This recognized reasonable geographic differences across the province, for example, the Northwestern Zone has about 30-per-cent water, which increases accessibility by boat and aircraft. It resulted in an earlier and more significant decline (75 per cent) in moose than elsewhere.
The zones permitted inclusion of historic information when data was collected by the district offices. Those regional boundaries also aligned reasonably well with certain WMU boundaries. You can view a map of those boundaries below.
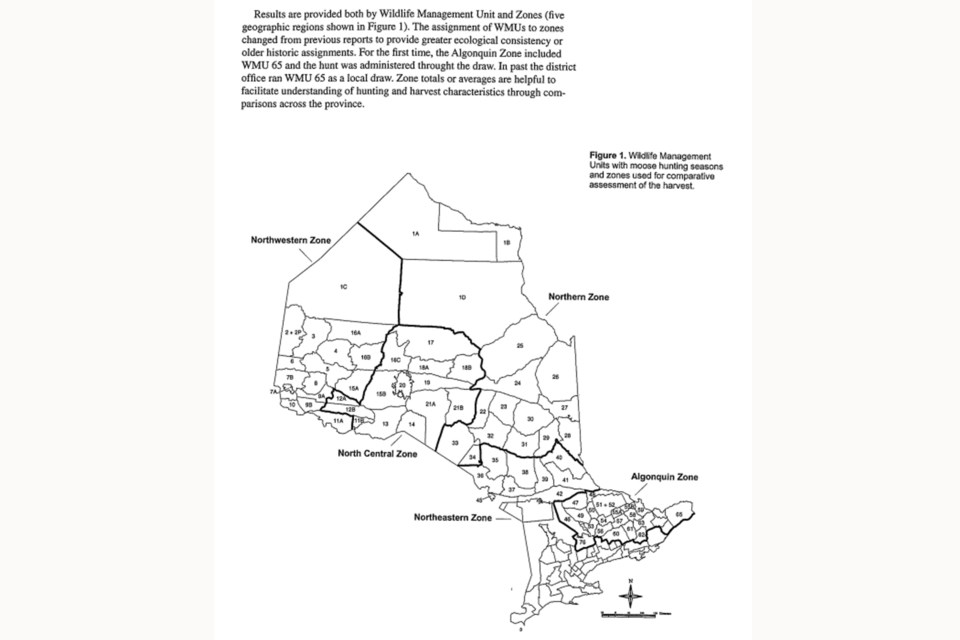
One of the problems trying to interpret information over a long period was that district and WMU boundaries occasionally changed and WMUs totally replaced Districts as survey areas. Large changes in small areas really messes things up, but small changes in large areas (like creating a small caribou unit from 21A) become largely irrelevant.
One of the nice things about databases is that you can aggregate in many ways simultaneously and choose the right one for the assessment you are undertaking.
I separated the Far North but presented information both with and without that separation. Current databases ignore that function and are organized on current region boundaries only. Too few and not sufficiently representative of differences for meaningful assessment purposes. It would have been simple to just add an additional level of aggregation without affecting the original database, but that was not done. More sloppy thinking.
I present only the first page of the tables. It is the headings that are important, not the numerical information below. That said, much can be learned from the tables.
In 1999, the harvest in the Northwest equalled the plan when the Far North was removed (See Table 1 below). It was 21-per-cent underharvested when it was included. The other two regions presented were overharvested by 46 and eight per cent. Hunting success was highest in the Northwest, mainly because there were fewer hunters, killing relatively the same number of moose. The most noticeable things from Table 2 (see below) are that hunters saw more moose in the Northwest, and the large effect of excluding the Far North.
Table One
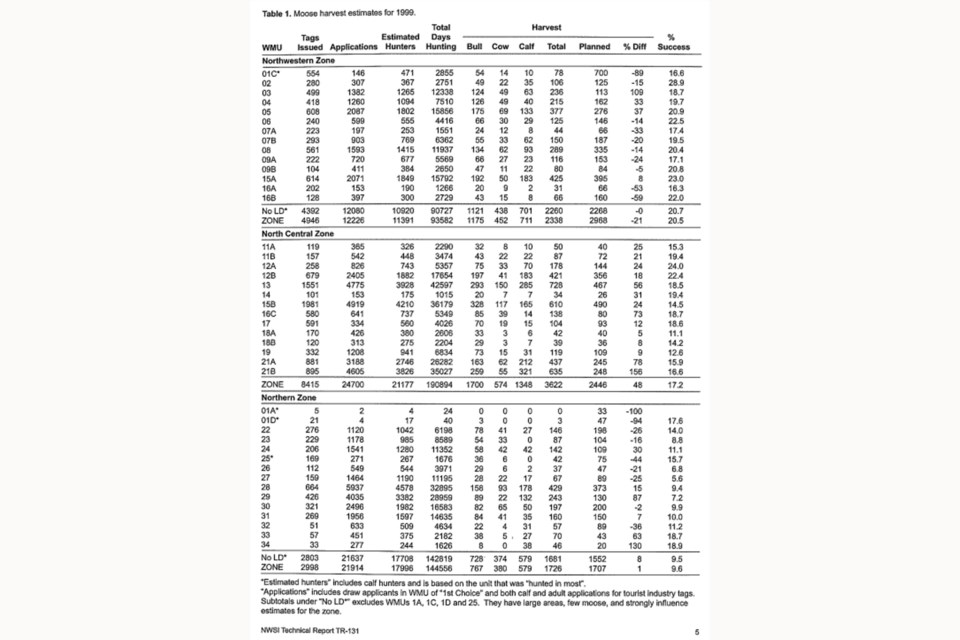
Table 2
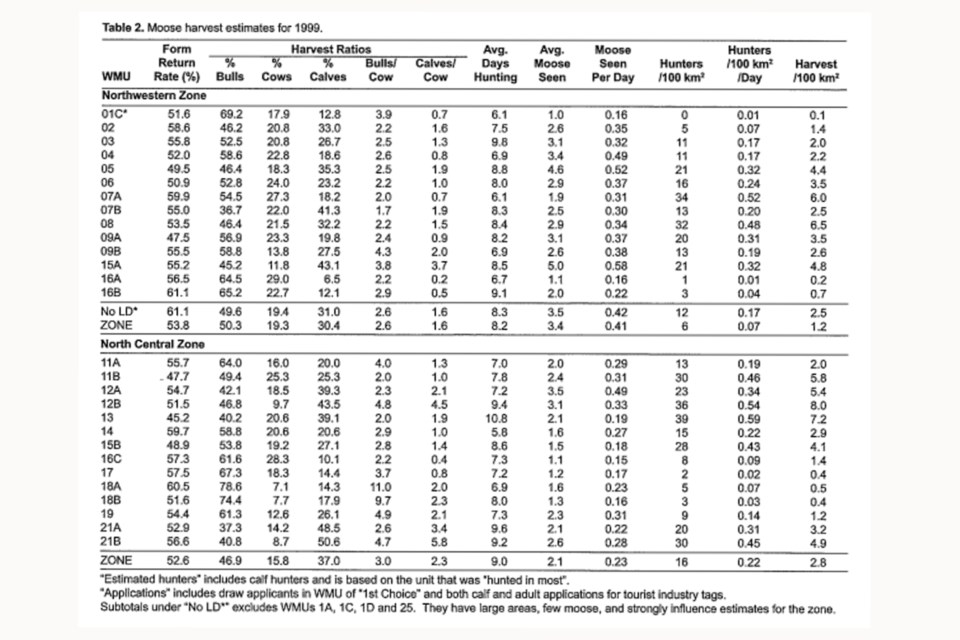
So, what is important about what I presented in 2002? The first thing is that all information was presented (Table 1). The second is that basic information has been turned into ancillary information like form return rates, harvest ratios and hunter densities (Table 2).
This information can help explain changes over time and have research value for comparing differences among units and zones. These zones, and the others, had harvest ratios close to what the guidelines recommend.
The problem was that in 1999 three of the five units had overharvests, with two at 50 per cent. The Northeastern zone was underharvested by 16 per cent. The provincial harvest was exceeded by 17 per cent.
In 2000, all zones were overharvested (also 17 per cent). At this time population targets were reduced, and the planned harvest increased by four per cent. Ya gotta wonder?
Note to current managers: The problem has always been overharvesting and I have seen absolutely nothing to let me believe that has changed since I retired.
Quit blaming incorrect age/sex ratios in the population. Get direct and predictable control of the harvest and start using some common sense with regard to sex ratios and the number of tags issued. Maybe you should clean up you information sets so they provide some useful information.
The third thing is that to understand the information properly it requires a degree of “professional” interpretation by someone who understands everything about that information. This can be done by including an “Interpretation Guide” (like a metadata table) that describes what the information is intended to show and how it might be used, or through publicly available reports (4, 5, 6, 7 as examples), or both.
The fourth point is that I provided copies of the reports to all MNR Districts (I think 10 copies), the Ontario Federation of Anglers and Hunters (I think 50 copies for distribution to their clubs) and to the Northern Ontario Tourist Outfitters Association (50 copies).
I have no idea what they did with them, but I saw nothing about possible problems in Ontario Out of Doors magazine.
As a related sidebar, I compiled and printed all of the moose information I took it to the OFAH with a couple of MNR managers. There were several questions like “What about WMU X?” The answer was always “Look at the harvest. It exceeds the plan”. In the following magazine was an article entitled “MNR Mismanagement Cost Hunters Tags”, in which they claimed to be Ontario’s lead conservation agency.
Writing an assessment report requires a knowledge of the entire information set and new information must be put into context. As an example, you can’t shorten the season, and conclude that it had reduced harvest when the harvest was declining in the period before the change and the many previous efforts to shorten seasons did not affect the harvest.
You can’t conclude that a population is increasing when changes in aircraft type and search intensity increase the number of animals counted on a plot or compare trapper and aircraft surveys as if they provide the same information.
In summary, the information sets I was given or are available publicly are just another example of government incompetence. The Harvest Information, supposedly a working database, is incomplete and has a variety of errors. The Tag Allocation Process set has an extremely limited utility, and the Hunter Activities and Harvest file is missing many years of information and much of the most basic information collected from the hunters.
What I believe to be a very significant error, makes the set unreliable and therefore useless.
I strongly applaud the government for this initiative. I just wish it could be done effectively and as an honest attempt to let the people of Ontario assess for themselves what is happening – at least as far as game management is concerned.
I would certainly like to see the many years of work I put into collecting all information on moose included because it is the numerical history of moose management in this province. Those sets contained tens of millions of dollars worth of information that have many purposes including historical understanding, research and a better information system for decision making if the organization was completed.
It wouldn’t surprise me if they were discarded by people not wise enough to understand their value or too lazy to maintain them.
As far as the other information I have received on moose, the state of the information seems to explain the problem with moose management on Ontario: garbage in, garbage out.
Alan Bisset is a retired regional moose biologist and wildlife inventory program leader with the former Ministry of Natural Resources. He has written and published many papers on moose management, both Internally and in scientific journals. Bisset lives in Strathroy, west of London, Ontario. You can find his other submissions by typing “Alan Bisset” into the searchbar at Sudbury.com.
References
- Ontario’s Open Data Directive. https://www.ontario.ca/page/ontarios-open-data-directive
- Ontario’s Digital and Data Directive https://www.ontario.ca/page/ontarios-digital-and-data-directive-2021#section-0
- Alan R. Bisset. 1999. Mandatory Reporting: an Implementation Strategy. Northwest Sci & Info. Thunder Bay, Ont. NWSI Technical Report TR-??. 13 pp.
- Alan R. Bisset. 2000. The Harvest of black bears through the tourism industry – a retrospective review. Ont. Min. Natur. Resour. Northwest Sci & Info. Thunder Bay, Ont. NWSI Technical Report TR-126. 149 pp.
- Alan R. Bisset. 1999. 1997 Moose and Deer Harvest in Ontario. Northwest Sci & Info. Thunder Bay, Ont. NWSI Technical Report TR-??. 18 pp.
- Alan R. Bisset, L. Dix-Gibson, M. McLaren, and J Mellor. 2000. 1998 Moose and Deer Harvest in Ontario. 27pp.
- Alan R. Bisset. 2002. 1999 – 2000 Moose Harvest in Ontario. Ont. Min. Natur. Resour. Northwest Sci & Info. Thunder Bay, Ont. NWSI Technical Report TR-131. 27 pp.
- Alan R. Bisset. 1996. Moose Population Aerial Inventory Plan for Ontario, 1996-1998. Northwest Sci & Info. Thunder Bay, Ont. NWSI Technical Report TR-??. 27 pp.
- Alan R. Bisset. 1999. Moose Population Aerial Inventory Plan for Ontario, 1999-2002. Northwest Sci & Info. Thunder Bay, Ont. NWSI Technical Report TR-??. 27 pp.
- Alan R, Bisset, Bob Crowell and Carl Hansson. 1998. Moose Aerial Inventory Pilot’s Manual. Northwest Sci & Info. Thunder Bay, Ont. NWSI Technical Report TR-??. 6 pp.