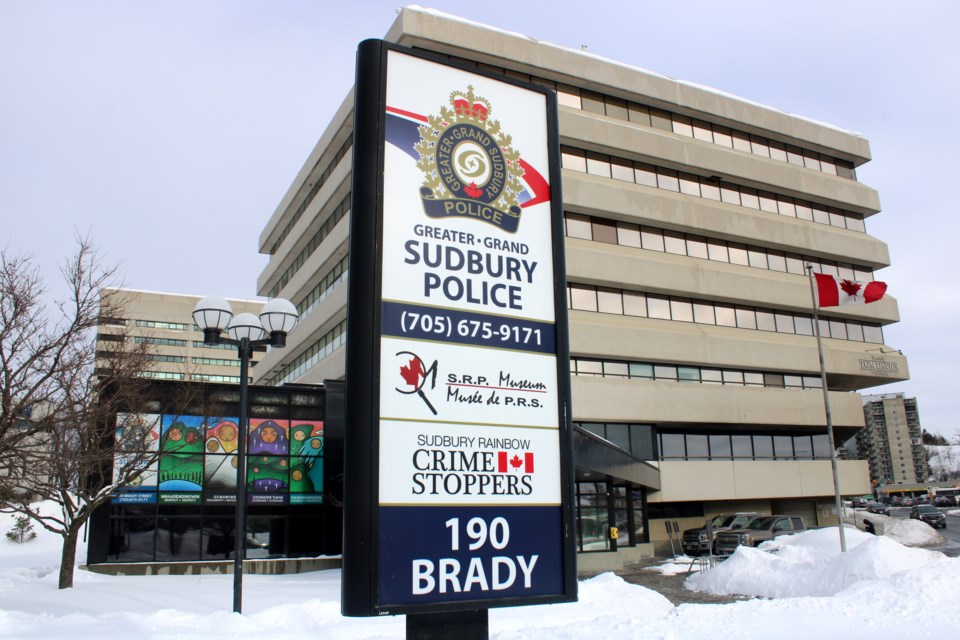
Update: A few months after this story was published, Greater Sudbury Police Service updated their 2022 crime statistics to reflect a 5.3 per cent increase in violent crime in 2022 and a property crime incident decrease of 9.3 per cent, for an overall crime incident decrease of one per cent that year. Click here for the June 2023 story.
Violent and property crime totals dropped across much of Greater Sudbury last year, with the most significant decrease recorded in the city’s downtown area.
Violent crime was down 4.91 per cent across the city in 2022, while property crime dropped by 14.25 per cent, yielding a combined total incident decrease of 11.05 per cent.
In Sudbury’s downtown, violent crime was halved and property crime dropped by 32.23 per cent, yielding a total combined decrease of 39.72 per cent.
The plunging crime rate shifted downtown’s rank as second in combined violent and property crime totals in a Greater Sudbury neighbourhood in 2021, to fifth.
Overall violent and property crime numbers also dropped in the nearby Donovan (down 10.37 per cent) and Flour Mill (down 30.79 per cent) neighbourhoods.
The drop in crime comes as no big surprise to Downtown Sudbury Business Improvement Area managing director Kyle Marcus, who said it’s the accumulative effect of various efforts.
“It’s really neat to see how everybody is all-encompassingly working together,” he said, listing the city, police and various organizations that work downtown as affecting change alongside the neighbourhood’s growing business community.
“It’s a pretty quick turnaround on some pretty big topics,” he added. “While nothing’s solved yet, and who knows if poverty and homelessness is ever solved, but to see how quickly they stepped in ... and took it absolutely seriously, was really nice to see.”
Downtowns throughout the country served as microcosms in recent years, he said, adding the COVID-19 pandemic exacerbated existing issues such as homelessness and addictions.
That said, he added, “Even when things were their worst they never lived up to the narrative that continually is perpetuated.”
There are some “human first” efforts on the horizon that will further help the city’s unhoused population, he said, including a 40-unit transitional housing complex city council in a decisive vote last year.
Digging deeper into the statistics, some neighbourhoods’ percentage change in property and violent crime totals are less relevant due to their low numbers. Whitefish, Naughton is one example, where the crime rate plunged by more than 59 per cent, but which only took a change of 13 incidents to accomplish.
Coniston recorded 65 incidents in 2021 and 86 in 2022, accounting for an increase of 32.31 per cent with a difference of only 21 incidents.
Some more statistically relevant increases include the approximately 20-per-cent jump recorded in both New Sudbury east of Barrydowne (615 to 743), and Minnow Lake area (326 to 394).
The most significant changes in overall total incidents was Downtown (drop of 456), followed by Flour Mill (379 drop), New Sudbury east of Barrydowne (128 increase), West End (118 drop), Chelmsford (115 drop) and Hanmer (101 increase).
Sudbury.com reached out to city police for additional context, and will report on their analysis of 2022 crime statistics and their neighbourhood breakdown later this week.
Messages have also been left with Ward 10 Coun. Fern Cormier (Downtown), Ward 12 Coun. Joscelyne Landry-Altmann (Flour Mill), as well as Mayor Paul Lefebvre’s office for additional insight.
Greater Sudbury neighbourhoods’ violent and property crime totals, ranked
The following are the 25 Greater Sudbury neighbourhoods’ violent and property crime totals, ranked from least to greatest according to 2022 statistics. 2021 totals are in brackets. It’s worth noting that areas with lower population densities start the list.
- Whitefish, Naughton: 9 (22)
- Worthington, Fairbanks: 21 (34)
- Skead, Falconbridge: 28 (26)
- Levack, Onaping: 38 (59)
- Dowling: 45 (42)
- Wahnapitae: 62 (73)
- Capreol: 82 (124)
- Coniston: 86 (65)
- Copper Cliff: 112 (115)
- Azilda: 159 (151)
- Lively: 162 (184)
- Hospital Area: 210 (260)
- Garson: 212 (219)
- Chelmsford: 255 (370)
- Val Caron, McRae Heights: 265 (240)
- Moonlight: 358 (378)
- Minnow Lake area: 394 (326)
- Hanmer: 414 (313)
- New Sudbury West of Barrydowne: 498 (514)
- West End: 553 (671)
- Downtown: 692 (1148)
- Donovan: 709 (791)
- New Sudbury East of Barrydowne: 743 (615)
- Flour Mill: 852 (1231)
- South End: 866 (826)
Tyler Clarke covers city hall and political affairs for Sudbury.com.
