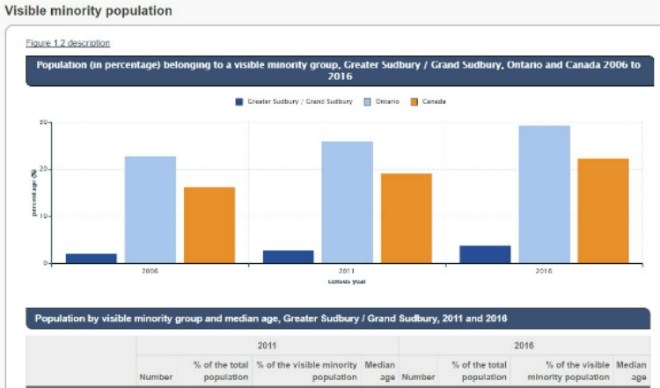
The number of people in Greater Sudbury who are members of a visible minority has increased to 5,990, or 3.8 per cent of the population, according to Census figures released by Statistics Canada.
That compares to 2006, when it was at 2.1 per cent, and 2.7 per cent in 2011. In Ontario as a whole, that figures sits at 29.3 per cent; across Canada, it's 22.3 per cent. Visible minorities includes 1,495 who hail from South Asia, 980 from China, 1,455 are African origin, 355 are Philippino, 610 are Arabs and 275 people are from Latin America.
The city's total population in 2016 was 161,815, up from 160,376 in 2011, a growth rate of 0.8 per cent. That compares to to 4.6 per cent for all of Ontario. There are 9,365 immigrants in Greater Sudbury, an increase of 1,005 since 2011. Italy is the biggest historic source of immigrants to Sudbury, followed by the UK, Finland, the U.S. and Germany.
Since 2011, however, 170 people from India have moved here, followed by 85 from the Philippines, 80 from Pakistan, 70 from the U.S. and 70 from Vietnam.
The average age in Sudbury 42.2 years old, with men averaging 41.1 years old and women 43.3.
In terms of marital status, there are 136,555 aged 15 and over in the city, of whom 78,490 are married or in common law relationships, and 58,065 are not married or living with a partner.
Average family size is 2.8 people. There are 30,365 married couples with a family, 8,310 common law families and 8,250 single parent families. Of those, 6,375 are woman and 1,880 are men.
There are 69,155 people living in houses, as opposed to apartments. Of those, 45,475 own their homes and 23,675 are renting, with 5,130 living in homes in need of major repairs
Across the city, 131,545 people said they most often spoke English at home, 20,725 said French and 3,255 spoke another language.
A total of 15,055 residents identify as Aboriginal, with 6,935 identifying as First Nations, 7,585 as Metis and 70 as Inuit.
In terms of demographics in Greater Sudbury, 15.5% of population is between age 0-14; 66.1 % are between age 15-64; 18.4 % are 65 or older; and, 2.4% are older than 85.
Other highlights from the information released by StatsCan Wednesday:
— The census counted 1.67 million Indigenous people in Canada in 2016, accounting for 4.9 per cent of the total population — up from 3.8 per cent in 2006 for a growth rate of 42.5 per cent over the last 10 years, four times the rate of the non-Indigenous population.
— The average age of the Indigenous population was 32.1 years, nearly a decade younger than the non-Indigenous population at 40.9 years. The census counted 145,645 children aged 0-4, 8.7 per cent of Aboriginal people in Canada.
— One in five Indigenous people in Canada is living in a dwelling that needs "major repairs," while one in 10 lives in a household that has a space shortfall of at least one bedroom. However, 7.3 per cent of Indigenous people in Canada are 65 or older, compared with 4.8 per cent in 2006 — and that proportion could double by the year 2036.
— The census counted 145,645 Indigenous children aged 0-4 in 2016.
— The number of people who identified as First Nations reached 979,230 last year, up 39.3 per cent over 2006, while the Metis population grew by 51.2 per cent over the same period to 587,545 people. The census recorded 65,025 Inuit, 29.1 per cent higher than in 2006.
— In 2016, 7.5 million people — about 21.9 per cent of the total population — reported being foreign-born individuals who immigrated to Canada. In 1921, the census reported that proportion at 22.3 per cent, the highest since Confederation. Statistics Canada projects that proportion could reach between 25 and 30 per cent by 2036.
— The census counted 1,212,075 new immigrants who permanently settled in Canada between 2011 and 2016, 3.5 per cent of the total population last year.
— 60 per cent entered under the economic category, 26.8 per cent to join family already in Canada and 11.6 per cent as refugees. During the first four months of 2016, refugees accounted for one-quarter of all immigrants admitted to Canada, thanks to an influx of refugees from Syria.
— Asia, including the Middle East, remains the largest source of recent immigrants to Canada at 61.8 per cent, followed by Africa at 13.4 per cent. Europe — once dominant in this category at 61.6 per cent in 1971 — ranked third at 11.6 per cent.
— More immigrants have been settling in the Prairies. The percentage of new immigrants living in Alberta reached 17.1 per cent in 2016, compared with 6.9 per cent in 2001; In Manitoba, it went to 5.2 per cent, up from 1.8 per cent, and four per cent in Saskatchewan, up from one per cent in 2001. Visible minorities numbered 7.7 million in 2016, of whom 30 per cent were born in Canada.
— More than 9.5 million of the 14.1 million households in Canada owned their home in 2016, a rate of 67.8 per cent, down slightly from 69 per cent in 2011. However, rates varied widely depending on age: 70 per cent of homeowners in 2016 were aged 35-54, compared with 20- to 34-year-olds at just 43.6 per cent.
— Nearly 1.9 million households — about 13.3 per cent — were living in condominiums in 2016, up 1.1 percentage points from 2011. Of those, about 67 per cent were owners, the rest renters.
– files from Canadian Press