Editor’s note: Gilbert Côté is a retired medical geneticist, and the former head of the genetics department at Sudbury Regional Hospital for more than two decades. This is the second time he’s offered his data-driven perspective on Ontario’s COVID-19 cases and response. You can read his insights from the end of April here.
We are bombarded daily with COVID-19 curves of all types. The information they convey is very clear, but their interpretation may be less so. I used the Ontario and Sudbury data as published on May 2, to try and explain the differences as I see them.
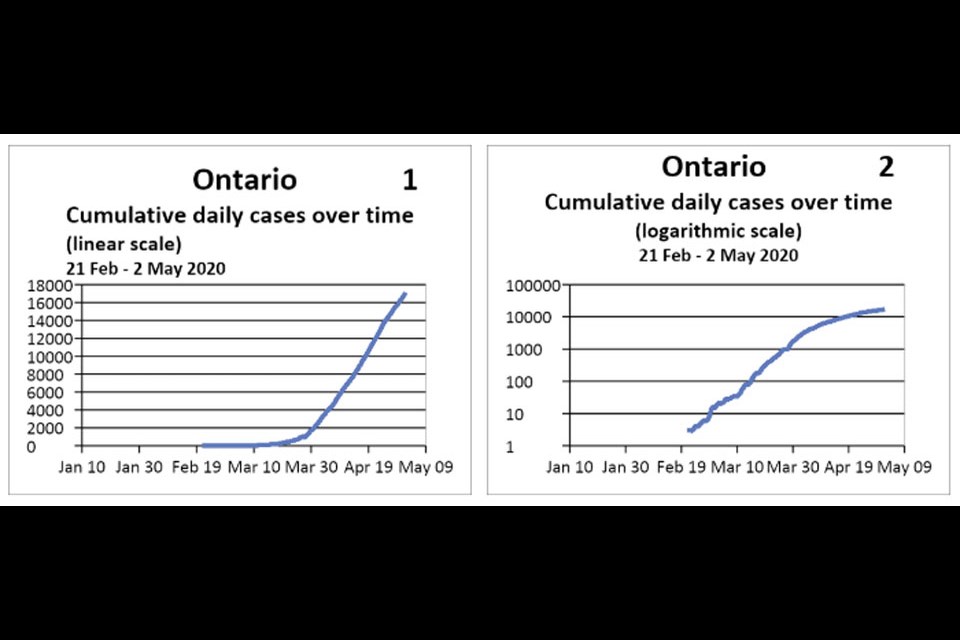
The first graph (Graph No. 1) shows the Ontario curve preferred by pessimists: the number of cumulative cases rises constantly over time and never goes down. Even after the pandemic is over, the line has normally reached a plateau and stays up there horizontally because the total number obviously never goes down.
Graph No. 2 is happier: by using the logarithm of the same numbers used in the previous graph, we get the impression that we are already on our way to reaching that plateau.
Instead of plotting cumulative numbers, we can use the daily numbers of new cases over time, as in Graph No. 3, to obtain a seemingly better outcome: this graph shows that not only did we reach the top of the curve, but we have succeeded in flattening it, with the daily numbers clearly diminishing.
The line is squiggly, but we can make it smoother by plotting the weekly cases (instead of daily), as in Graph No. 4. That line is definitely going down, and we hope that if we are careful, it will keep on going down nicely, as it came up, without springing up again.
Additional information can be gained by plotting the presently very encouraging Graph No. 5 with the weekly numbers of cases against the cumulative cases on a logarithmic scale. In unaware communities where no preventive measures were in place, COVID-19 started everywhere with a two-day doubling rate of infection, following exactly the dotted line drawn on the left.
We had advanced warning in Ontario and started with a three-day doubling rate for several days, then improved to a four-day rate until the stricter emergency measures started giving more positive results. The graph shows that we have now reached an expected doubling rate of about 22 days.
When we eventually get closer to stopping the virus, the tip of this particular curve will turn down dramatically, almost drop vertically, as it did in Taiwan, New Zealand, Australia and South Korea, New Brunswick and Newfoundland. Obviously, we have not reached this drop in Ontario. A more sobering picture is obtained when we plot the number of daily deaths over time, as in Graph No. 6. We will be able to claim victory when the number of daily deaths drops below the red line and stays there for a couple of weeks.
Sudbury is doing much better than southern Ontario, thanks to our remoteness, open country and physical distancing measures. Despite the very low numbers of infected individuals, the pessimistic Graph No. 7 shows an unabated steady increase. However, the encouraging logarithmic Graph No. 8 shows how the curve of weekly vs cumulative cases is on its way down, having reached an expected 27-day doubling rate of infection.
We managed to reach a vertical drop, went up again and will hopefully go back to a final drop if we keep our distances and meticulously wash our hands.
Lengthy lockdowns are not essential if everyone is e-x-t-r-e-m-e-l-y careful. Sweden did not lockdown and ended up with curves similar to those seen in Canada, but they paid the price with a much higher death rate. The “bunch of yahoos” decried by Premier Doug Ford is a mixture of justifiably concerned citizens together with dangerous people who want to party no matter what. There have been disquieting reports, in other jurisdictions, of deranged people spitting purposely on elevator buttons and grocery shelves: it only takes one person to infect many, with terrible consequences.
So let us still be careful, keep physical distancing as much as we can, and follow the guidelines issued daily by our leaders and medical officers of health. We had two unfortunate deaths from the virus in Greater Sudbury so far: Let’s keep it that way, and stay safe.
Gilbert Côté
Sudbury