The fight against COVID-19 cannot be waged effectively without good information, good data.
Sudbury’s Gilbert Côté is a retired medical geneticist, and the former head of the genetics department at Sudbury Regional Hospital for more than two decades. He said he has been surprised by some of the views of the situation taken by public figures, and found himself fielding questions from worried friends, naturally concerned, but also confused, by all the information released on the pandemic.
“As a medical geneticist with a mathematical bent, I have been surprised by the mistaken views on COVID-19 adopted by some influential public figures around the world, by the generally very appropriate behaviour of Canadian politicians, but also by the insufficiently clear reporting and presentation of the data in the media,” Côté said. “I started compiling my own tables to see what was happening.”
Being a data guy at heart, Côté began to produce graphs to help interpret the spread of the infection, track it and see where it deviates from expectations.
“I plotted on a logarithmic graph the numbers of weekly infections against the cumulative totals for Canada, Ontario, Ottawa and Greater Sudbury, with the figures published daily by the public health units and other official governmental agencies,” he said.
“Throughout the world, these graphs consistently show how the data initially shoot up in a straight line, eventually flatten and then fall down dramatically either because everyone is infected, or because physical distancing is working, or because the authorities are failing to gather or report the full facts.”
What he found with the most recent data is cause for optimism. The curves for Canada, Ontario and Ottawa are finally starting to deviate from the climbing straight line, indicating infection rates are beginning to flatten.
“But they have not yet turned downwards, perhaps because people have relaxed distancing or because more cases are detected thanks to increased testing,” he said.
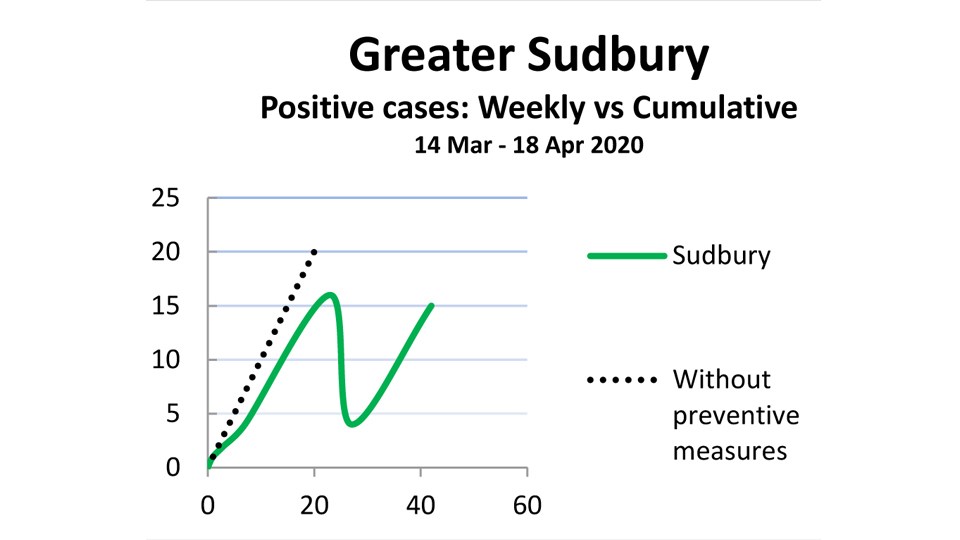
Greater Sudbury’s graph looks different. The line deviates, drops and then climbs again.
“While we started very well, with nearly all cases due to returning infected travellers, the curve sharply fell down as we all hoped, but shot up again because of more returning travellers, as well as the beginning of community contamination,” Côté said. “Social distancing in Sudbury is definitely not working as expected, and Mayor Bigger did well to declare a state of emergency.”
Côté hopes by releasing the graphs, Sudburians will see that it is still too early to start relaxing physical distancing and other measures to limit virus spread.
“Either way, it means that we must still stay at home, keep our distances and wash our hands. We are not yet over the hill,” he said.
In Côté’s opinion, “confinement measures” can only be lifted once testing is widely available, the curve drops down and mortality rates fall to single digits for 16 to 20 straight days.
“We are fortunate enough in Canada to learn from the experience, good or bad, acquired in countries who got infected first,” he said. “The availability of online grocery orders, curbside pick-up and home delivery in Sudbury is extremely convenient and will help us protect each other and go back sooner to a new normality.
“As a senior, I miss going out, but am most grateful when younger, brave souls are there to kindly help.”