Since last fall I have submitted several articles regarding my concerns for the management of Ontario’s moose and caribou.
Because of the complex nature of the problem, they required lots of words and numbers. I thought I’d try a different approach using graphs to explain the history of moose management since Selective Harvest was introduced in 1983. The information comes through Freedom of Information Act (FOI) and records I retained from when I was working.
Everything depends on the moose population itself, so let’s look at that first.
Counting moose
From 1959, population estimates have been done using aerial inventories performed during the winter. Moose can be counted using tracks to help find the animals. For a variety of reasons, such as dense cover or poor snow conditions, not all moose are counted.
There are ways to adjust for this error. The first two involve guessing — just guessing, outright, how many might be missed — or by using discrete groups of tracks to estimate them. Both methods are better when there are good snow conditions and few moose.
Plain guesses were used until 1976 when the second method was adopted. The history of these surveys shows the missed number was about 30 per cent from 1975 to 1981, when it dropped to around 20 per cent. Then, it stabilized at 10 per cent between 1988 and 2001, when my information ends.
I think there was a lot of confusion about the switch in technique and observers were still using the old “just guess” method, but the analysis counted them as if they were track aggregates. This would more than double the missed moose estimate and probably accounts for the 30-per-cent-missed estimate.
If I recall correctly, I used “moose seen” (MS) for harvest planning, although the northwest had values at eight per cent or lower after 1983. Err on the side of conservation.
A more scientific and slightly more expensive method was to refly the plot immediately after the first survey, using all the information from that survey to determine if moose were missed. It was done in the northwest for a year or two, and there was found to be a 20-per-cent error for both planes and helicopters.
An effort was made to survey units every three years with standard surveys using 2.5-km by 10-km plots. The far north was surveyed using transects once during the environmental assessment for a tract of land that Reed Paper wanted to log. It may have been done once or twice since, as a spinoff of caribou surveys. Units around Algonquin Park went 13 years without any surveys, prior to about 1992.
Because of the time between surveys and the stratification process, it is difficult to determine a provincial estimate statistically. Initially, it was done by assuming the plots flown each year were representative of all plots. By multiplying average moose per plot by the number of plots, you could create an estimate.
The problem was that some high-density units (e.g., WMU 13) were sampled more frequently than others. This resulted in an irregular pattern rather than the smooth curve that would be expected.
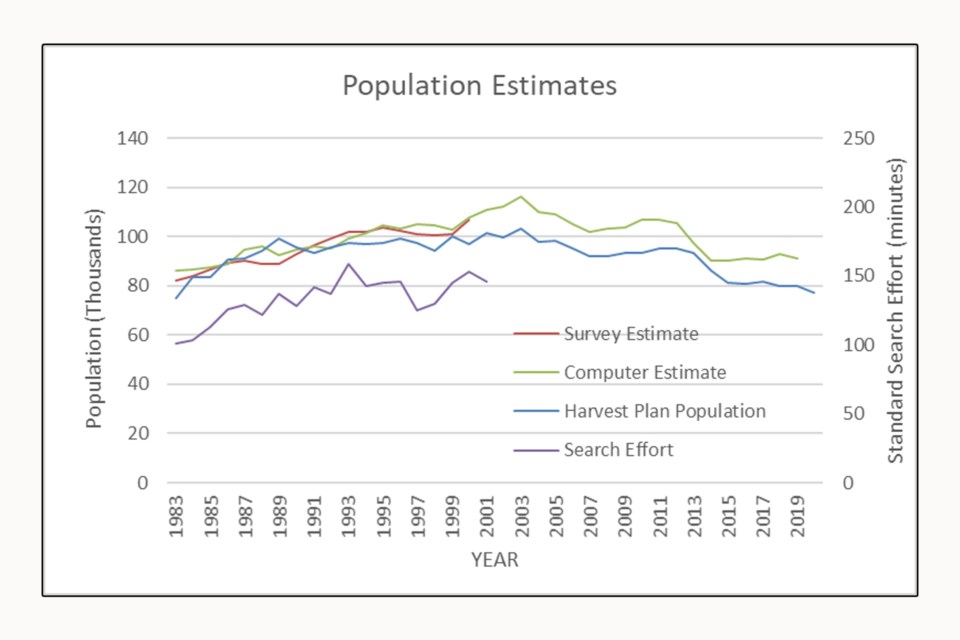
It is possible to add up the individual surveys, either by assuming there was no change until the next survey, or by estimating values (interpolating) between surveys. I did it both ways and there is only a few thousand animals difference. The interpolated estimates are presented as Survey Estimate in the graph.
I requested population information under the FOI and was given an information set with population estimates that were “dynamically generated from the WMU level records … using the R computer programming language”.
A flawed system?
There was no explanation of how the estimates are being used. My concern is that during the period when the dynamic and survey estimates overlap, the dynamic estimate averages 6,000 or six-per-cent more moose than the survey estimate using real population values. It continues to be higher and further from the estimates used for planning, which are based on real survey data.
I recently received another set of estimates for the past seven years. These estimates appear to be computer generated but differ slightly from the FOI information. I’m wondering how many different estimates really exist and which ones are the correct ones.
Without knowing much about it, I have no problem with the synthetic, computer-generated estimate. It follows the basic pattern of real estimates and may include something to compensate for missed moose.
The main difference is the rise and decline are steeper. The higher values mean the population modeling used to create the original harvest guidelines (1) are no longer valid.
In fact, they started to become invalid when search intensity started to increase and survey altitude and airspeed started to drop. Modelling was done using older information with a greater error in the number of moose missed (the sightability bias).
If MNRF is using this synthetic population for planning and recommends a four-per-cent harvest for growth, then it would be more like 3.8 percent of the lower, real, surveyed population estimates I refer to below.
The third population estimate in the graph is that used for harvest planning. It is based on aerial estimates but tempered by local knowledge regarding the survey quality and trend. This, too, parallels the survey and dynamic estimates, except in the early years of the program when people were excited about the new program and anticipated growth.
While the synthetic population predicts a slight increase in population in recent years, the numbers used in the plan indicates a continued decline.
The graph also shows the “standard search effort”. It is a crude way to compare “eyes on the ground” when using two, three and four place aircraft. That effort increases from about 100 minutes to 145 minutes per plot, a 45-per-cent increase.
The main point of this graph is that I do not believe the population increased as the numbers suggest. Some (or much?) of that change was due to the change in search effort.
There is an alternative explanation that because there were more moose, it required longer to survey them. That is certainly true to a limited extent. That the moose population in the northwest increased from about 10,000 in the mid 1970s to 25,000 in 2001 (a 250-per-cent increase) with only a 33-per-cent increase in search effort, while other zones had smaller increases and greater increases in search effort, seems to suggest that most of the increase in search time was not the result of an increased population.
I know that some regions intentionally increased search effort to get a better estimate of the population and there was a switch to helicopters flying at slower speeds.
Understanding population
There is little I see in the information that lets me believe it was a real increase in population, except in the northwest zone where search effort was intentionally kept as stable as possible. If the provincial population did increase, it certainly wasn’t because the harvest was reduced, or because tags were controlling the kill.
There is a related point, with management implications, regarding the history of population inventories and the potential for moose populations in Ontario.
Surveys in the 1960s and 1970s, used large plots (four-mile by four-mile), were flown at high altitude (900 feet) and higher airspeeds (150 mph). I recall reading a report that estimated the population at 160,000 moose with a range between 120,000 and 250,000. The lower number was the estimate used publicly. Whether that report was a figment of my imagination or not, the real average densities from those early survey plots were used to determine target populations that were written into district land use plans.
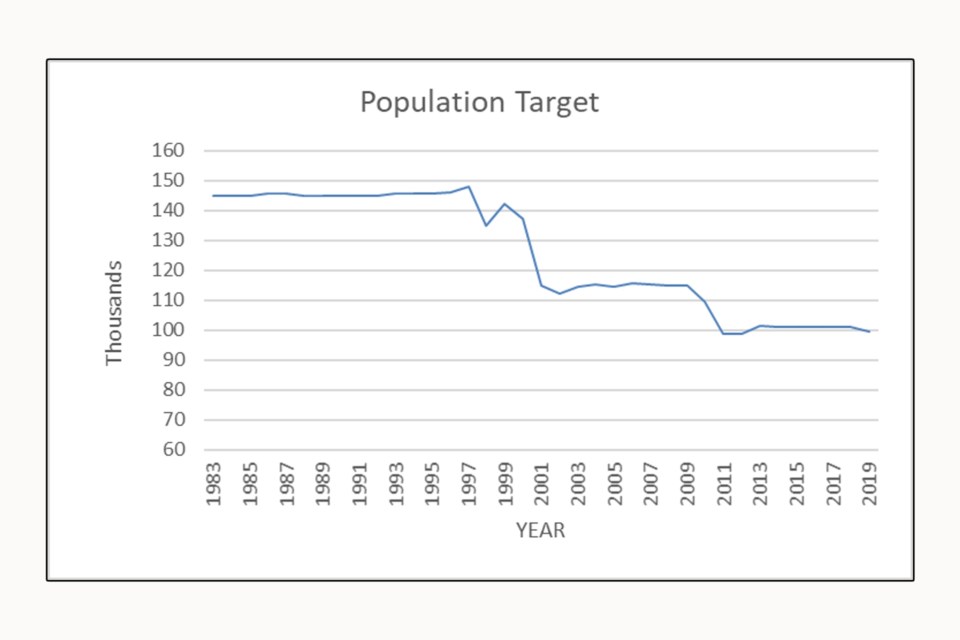
Interestingly, the population target, as calculated for the province was about 157,000, almost exactly what I remember the report saying. And that was without any correction for missed moose. The target in the core range was 145,000. The fluctuations in the graph between 1997 and 2000 appear to be result of missing information.
With that target population estimate and the results of the resurvey plots done under “modern” survey methods, I believe the real population in the 1960s was more likely in the 300,000 to 400,000 range. Only real adaptive management will determine the true potential.
At the time of those surveys, logging was still a manual process. According to Husqvara.com, chainsaws started being marketed in the mid 1950s. Machinefinder.blog indicates that skidders came online in the mid-1960s and harvesters in the mid-1970s. Road access into the forest was relative limited before that.
Consequently, I believe those moose lived in balance with their ecosystem and as such should be a much better indicator of the true population potential than a computer model using depressed moose numbers in relation to habitat relationships that have not been demonstrated to be reliable.
That is why true adaptive management, not hypothesis-based computer models, is essential to gaining the optimum benefits from this resource.
Target populations were reduced in 2000 because MNRF biologists had failed to achieve the promised population growth because of excessive harvest plans and excessive harvests. Targets were essentially reduced to existing populations, yet they have continued to decline. It appears they were lowered again about 2009 for reasons that have not been explained. Again, it may just be missing information.
When you have both good habitat management and effective harvest control, the theory is that habitat can be managed to create higher populations than random natural events. It certainly doesn’t appear that Ontario subscribes to that philosophy. Current population objectives are near or below the estimates from about 2000 and well below historic levels.
Further, the effort to produce monocultures of conifer through forestry in the boreal forestry flies in the face of all the rhetoric about biodiversity. The ministry is saying one thing, but foresters are doing something else.
Getting a reliable estimate of the population is probably the most difficult aspect of game management. After that, it is just a matter of planning the harvest, issuing tags, assessing the results and modifying the plan if results are not as expected.
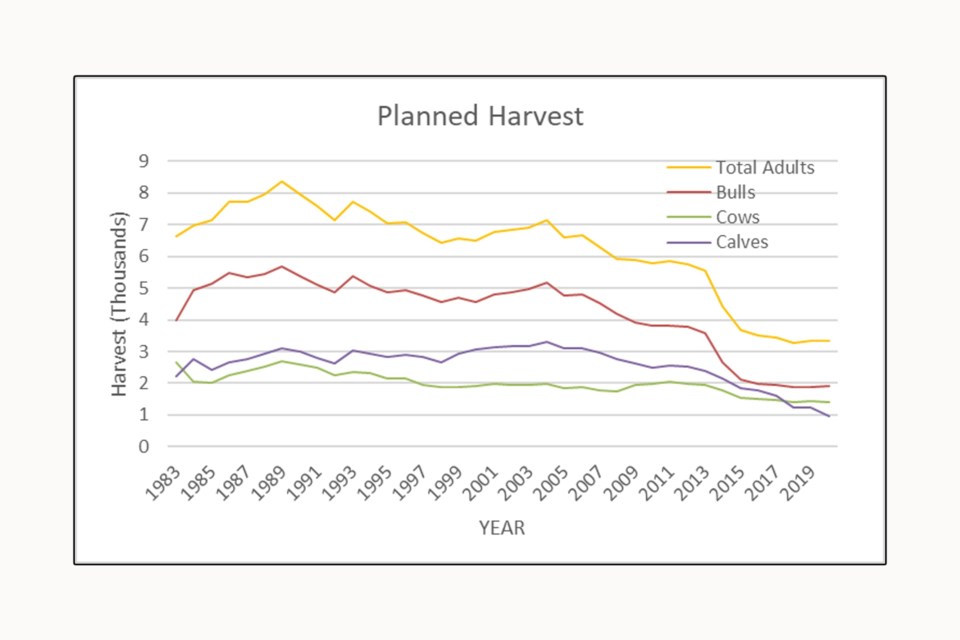
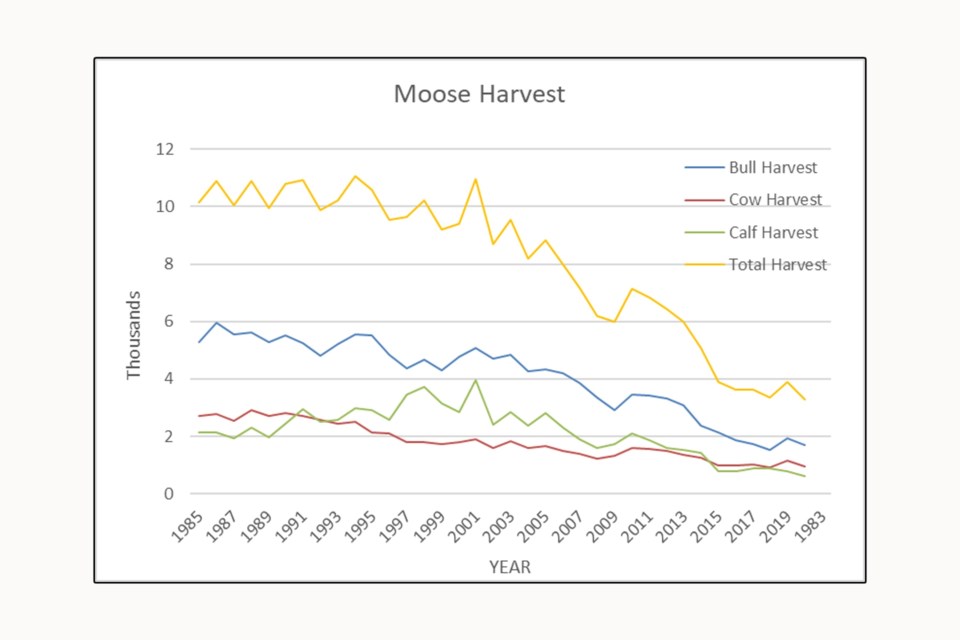
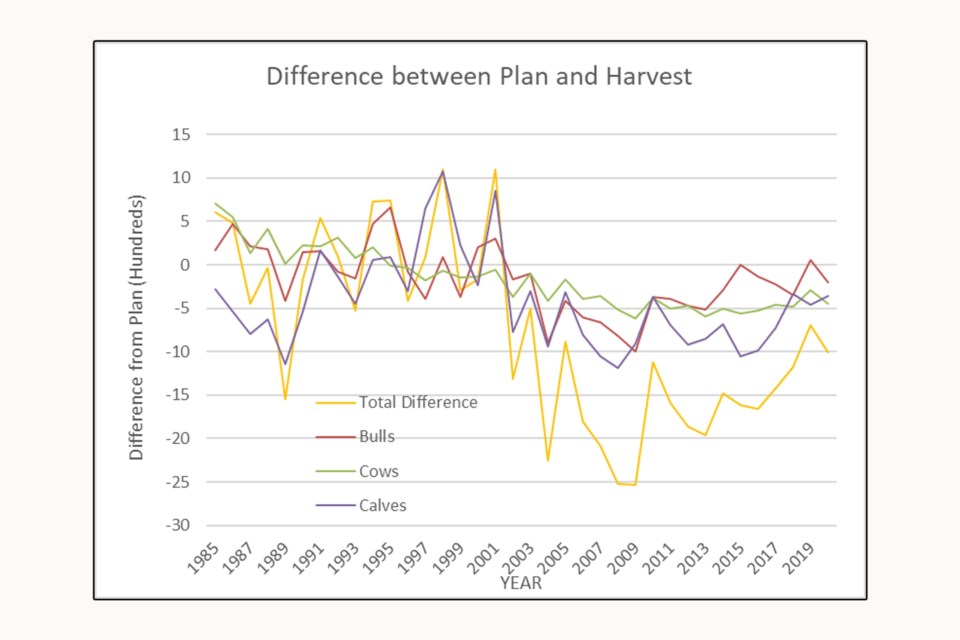
The planned harvest numbers initially increased in response to the expectation the population was growing. Thereafter, it started to decline slightly until about 2012 when there was major reduction. The ratio among age/sex classes was close to the guideline recommendation of about 50-per-cent bulls, 20-per-cent cows and 30-per-cent calves until recently.
Perhaps the two most significant aspects of this graph are that the reduction was mostly in the bull harvest and in recent years, the planned cow harvest has exceeded the calf harvest. As written elsewhere, the logic of this totally escapes me (and all my peers).
In a declining population, you want to protect the breeding stock, especially the females.
The numeric values of the planned harvest are not as important as the relationship of the planned harvest to the planning guidelines (and to adaptive management principles). Harvest planning can be a relatively complicated matter and depends on the quality of the aerial survey and estimates of age and sex ratios. There are several ways to approach it as well. For example, it can be based on a percent of cows in the mid-winter population multiplied by the desired bull:cow:calf ratio, or just a percent of the total population divided into age and sex classed. Most managers chose the latter method.
The planning guidelines “suggest that moose populations can be sustained at harvest levels around 12 per cent of the mid-winter (aerial inventory) population … rates of eight per cent or less may be required to initiate growth.” (1, p4).
Selective failure
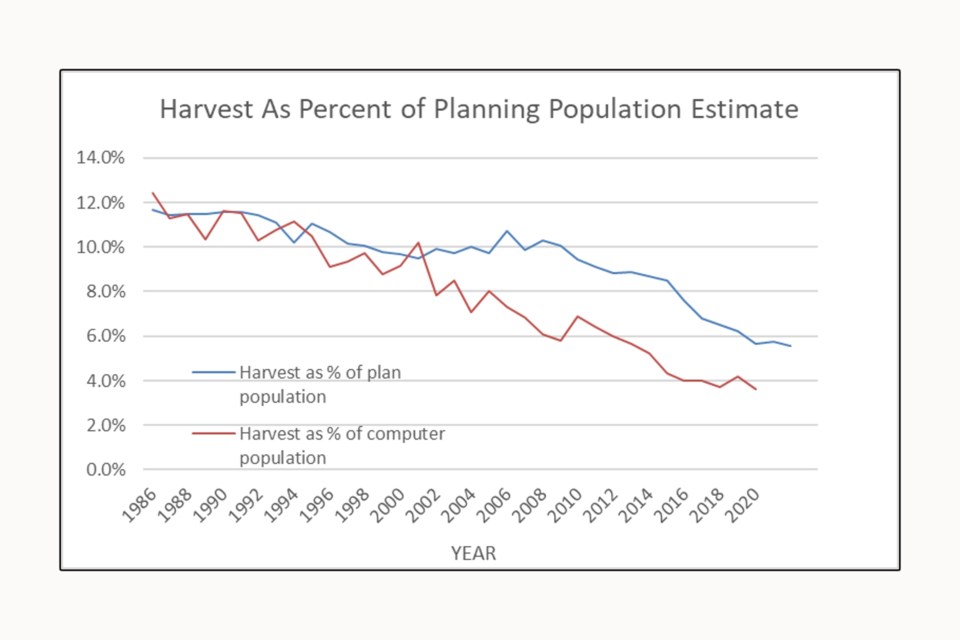
Although every unit in the province was deemed to be capable of supporting more moose, the planned harvest in most regions was set to maintain populations, not increase them. Provincial rates averaged more than 11 per cent from 1986 to 1993, then dropped to about 10 per cent until 2008 when it was steadily reduced to 5.5 per cent in 2020.
These results are based on harvest plans using aerial inventory estimates for the population.
If you use the synthetic population numbers, then planning doesn’t appear as bad. However, if the recommendation of a four-per-cent harvest is based on the synthetic population it would apply to all years, not just recent ones.
As such, it has only been in the past few years the harvest plan has even approached a stage where the population might grow. That said, the planned harvest in 2021 was 5.5 per cent, which exceeds the recommendation by 37 per cent.
I don’t recall how we decided on the tag filling rate, but I expect previous success rates were used in most regions. Party hunting was prohibited at the time Selective Harvests was introduced and two tags were required to claim a moose.
One region believed that hunter behaviour would change overnight, used a low fill rate and allocated more adult tags than there had been hunters in the past. So much for adult tags controlling the kill. When the harvest was excessive, they wanted to shorten the season. So much for understanding how limited numbers of tags under Selective Harvest was designed to control the kill.
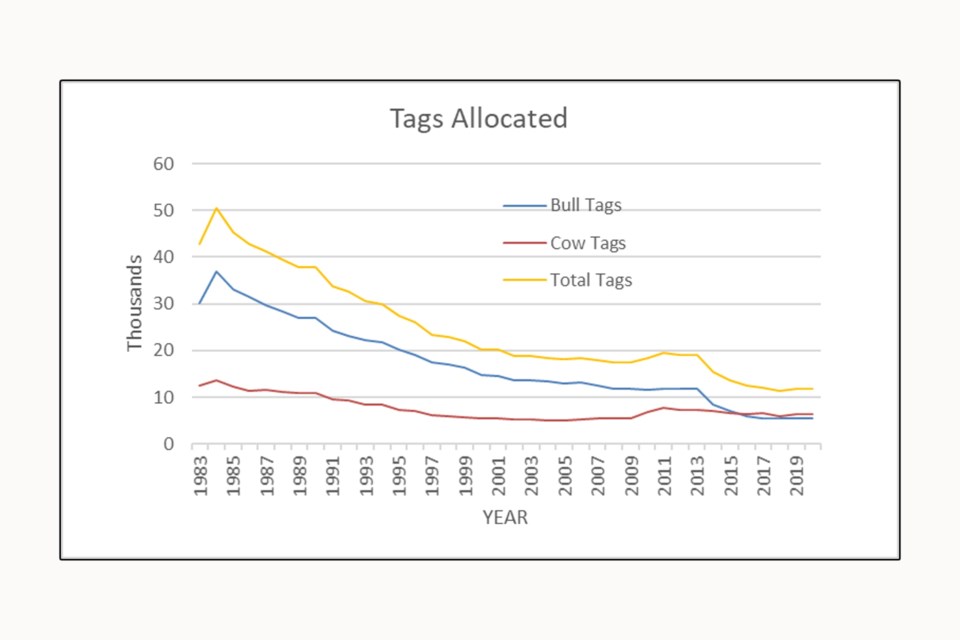
Tag numbers have gone down steadily almost from the beginning, except for an increase for a few years about 2010. After 2014, there was a major reduction, except in cow tags which have increased in relation to other tags.
In contradiction to the decline in tags, the harvest remained constant until about 2002, when it started to decline precipitously. My records indicate that between 1970 and 1974, the harvest averaged 14,300 moose. I am missing the estimates from then to 1983, but I believe that it was already decreasing from that period to the 10,000 or 11,000 shown in the graph. I don’t believe the selective harvest program actually reduced the harvest at all.
Again, the pattern of harvest needs to be put into context. Certainly, from the mid 1970s to probably 2000 or later, logging and road expansion was increasing at a rapid rate. Prior to this there was ample evidence a lot of moose were being harvested in newly logged areas (the “end of the road” phenomenon).
Surveys showed the moose were there before, not after, logging. Some hunters thought that they had just moved out. I agreed they had moved out, but it was in the back of pickup trucks, not voluntarily wandering off in search of greener pastures.
My sense is the harvest was carried by the end-of-the-road phenomenon until there was little or no more road expansion. There was no untapped reservoir of moose and the harvest started to decline below planned levels. It’s like keeping poor records of your finances but continuing to write cheques until one day they are returned NSF and you find yourself SOL.
I have pointed out that neither the tag allocation nor the planned harvest have really controlled what happened. Between 1984 and 1996, the tags were reduced by 50 per cent but the harvest was not really reduced at all. This and major tag reductions in some units without a reduction in harvest were the first pieces of evidence that tags were not controlling the harvest.
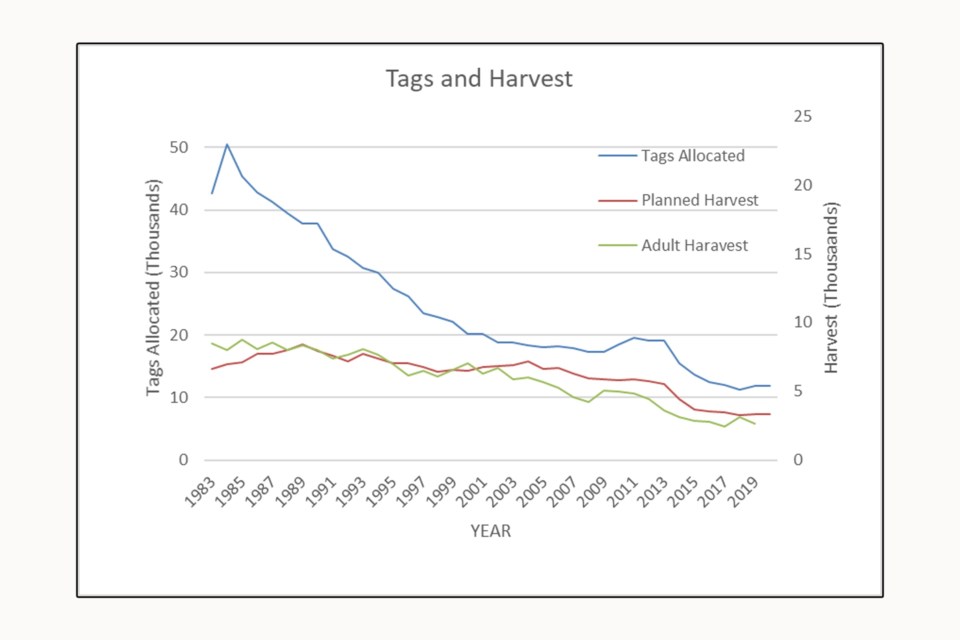
Until about 2012, the harvest generally exceeded the plan, then the opposite occurred where the harvest could not meet the plan. It seems the end of the end of the road had arrived.
In the previous graph you can clearly see that the harvest is literally all over the chart. If tags did control the harvest, all the lines would be almost straight and along the zero line. Because there is no clear relationship between tags and harvest, or planned harvest and the numbers of animals killed, it is impossible to predict the outcome of a plan.
In short, there is no functional harvest control. The harvest depends on vulnerable animals, those unfortunate enough to be in the wrong place at the wrong time.
I will go back to my old refrain. Since 2002, the moose harvest has consistently fallen below what is planned. If the moose are really there to be harvested, then why isn’t the ministry increasing the tags even more to harvest them? Isn’t that what the tag-filling rate is intended to do?
I have mentioned in almost every article the idea that it could take decades to restore populations that have crashed. When I retired in 2000, the Aulneau Peninsula had one of the highest-density populations in the province at more than one-moose-per-km-squared. The population there and in surrounding units started to decline precipitously after that.
On the Aulneau, it fell from over 1,000 to 28 and lower by 2011. Similar declines occurred in 6, 7B and 9B. It has been ten years, and there appears to be no recovery in sight. Tags, albeit few, are still being offered in all these units.
I’m certainly not an advocate of closing seasons, but when you plan to harvest 0.5 per cent of a population estimated to be 21 animals (unit 7A, 2017 to 2021), you might as well admit defeat and functionally close the season by issuing no tags at all.
Initially, I looked at those numbers, took them at face value, and wrote the sentence above. After giving it more thought, I realized how absolutely ludicrous such a plan was. Point-zero-five per cent of a population of 21 isn’t even a front quarter of a moose.
MNRF should provide some direction on how a hunter should achieve that in order to meet the planning objective of 0.5 per cent. Maybe just shoot the ears off or an antler for trophy hunters.
Those moose are at such a low density that taking even one would contribute to further decline and exceeds the MNRF harvest guidelines. It is a blatant mockery of the art and science of game management to even consider hunting in those units at this time.
These units illustrate the problem with management philosophy since population decline was clearly recognized. MNRF has tried to stem the decline, but simply haven’t done enough to get ahead of the curve.
Instead of telling hunters what was necessary to restore the population, MNRF conducted reviews asking hunters how to make hunting better (2, 3). Failing to recognize that tags have never controlled the kill and issuing far more tags than necessary has not helped the situation.
Neither did changing the harvest control system — just another distraction from the real problem of overharvesting. While it has the only real potential to restore the herd, MNRF staff and the Big Game Management Advisory Committee have totally ignored the most fundamental aspect of that change.
Tag numbers went up again this year.
There is one glimmer of hope. I spoke with the Senior Wildlife Policy Advisor. He informed me that IF they get the population numbers to change direction by 2030, they MAY consider increasing the population objectives.
Now there is a positive attitude from a person who really understands what adaptive management and socio-economic benefits are. Yes, I am being facetious.
Chances are that I will not be around to see that, but it doesn’t matter, because unless something drastic changes, chances are that it won’t be happening.
Alan Bisset is a retired regional moose biologist and wildlife inventory program leader with the former Ministry of Natural Resources. He has written and published many papers on moose management, both Internally and in scientific journals. Bisset lives in Strathroy, west of London, Ontario. You can find his other submissions by typing “Alan Bisset” into the searchbar at Sudbury.com.
References
- Guidelines for Moose Harvest planning. 1994, Alan R. Bisset. OMNR. Internal document. It is based on, and includes the work done by Craig Greenwood, Dave Euler, and Ken Morrison. 1983. OMNR internal document.
- Moose Management Review, 2019. Big Game Management Committee, https://www.ofah.org/wp-content/uploads/2019/05/MMR-engagement-presentation-May182019-compressed-002.pdf.
- Ontario Moose Hunting and Moose Management Survey. 2014 (?). https://www.ofah.org/wp-content/uploads/2015/03/Provincial-Survey-Summary-of-Results.pdf